Supermicro IPMI Telegraf plugin

As your homelab grows, you need to keep an eye things. Creating dashboards to visualize your homelab environment becomes essential. In this post I'll give a brief overview of the TICK and TIG stacks and talk about a plugin I developed for Telegraf that's used to monitor IPMI sensor data from Supermicro servers.
Once your homelab gets to the point where it's being racked, you know you have a problem, noise. Rackmount servers are pieces of enterprise equipment typically found in data centers or purpose built rooms. As such they generally give zero F's about the noise they produce. When you bring them into the home environment, noise reduction definitely becomes a priority. To that end I swapped out the stock fans in my 1U server with Noctua NF-A4x20 fans. While these fans are much quieter, they also move less air so monitoring system temperatures will be important.
Enter the TICK stack! The high level overview is that Telegraf is installed and configured on your hardware, which feeds data to InfluxDB, which is then presented through dashboards in Chronograf. Kapacitor is the real time data processing engine, I haven't had a need for this so I skip it.
TICK
- Telegraf - metric collection/reporting
- InfluxDB - time series database
- Chronograf - dashboards and aministration
- Kapacitor - real time data processing
TIG
- Telegraf
- InfluxDB
- Grafana - dashboard and visualization engine
TIG is a slightly different approach that replaces Chronograf with Grafana for visualizations and dashboarding. With Chronograf gone you'll need to admin your InfluxDB instance directly. You can also run Chronograf alongside Grafana which is what I do. So far I've found it's nice to have Chronograf for the admin features, though I still had to do some direct InfluxDB configuration. The UI also feels a little more slick and updated. But it's also nice to have Grafana because it's extremely easy to import pre-configured dashboards. This means you're staring at pretty charts and graphs within minutes instead of manually configuring visualizations and queries.
So to get started I know my server has IPMI and there's already a plugin for that! Great! While I was able to quickly configure the server and Telegraf plugin to report IPMI data, I wasn't seeing everything that I was expecting. The fan readings were normal but there was still the unmistakable whine of a fan...wurring, up and down, while the reported readings were steady. Upon closer inspection I realized that most of the noise is coming from the power supply. Now, there's not really a whole lot we can do here but I did notice when logging into the IPMI server or iPhone app, that I could see power supply readings like temps, voltages, and fan speeds. Great! So then why was I not seeing this data being logged? Well it seems ipmitool which the existing plugin implements, simply does not seem to be able to retrieve the power supply data. After faffing around google for a bit I discovered SMCIPMITool, essentially Supermicro's own command line IPMI utility that reports power supply data!
Great! Back to Telegraf! Since it's plugin based and open source, I can create a new plugin to implement the SMCIPMITool utility, get the data I want, and contribute to the plugin library! I'll spare you the agony of the actual development, since the project is open source you can check out my fork or follow the pull request.
While I won't dive deep into Telegraf plugin development I do want to point out some posts that I found very helpful for getting started with Go and Telegraf plugin development.
- https://howistart.org/posts/go/1/
- https://dzone.com/articles/monitoring-cryptocurrency-with-influxdb-amp-telegr
- https://blog.alexellis.io/golang-writing-unit-tests/
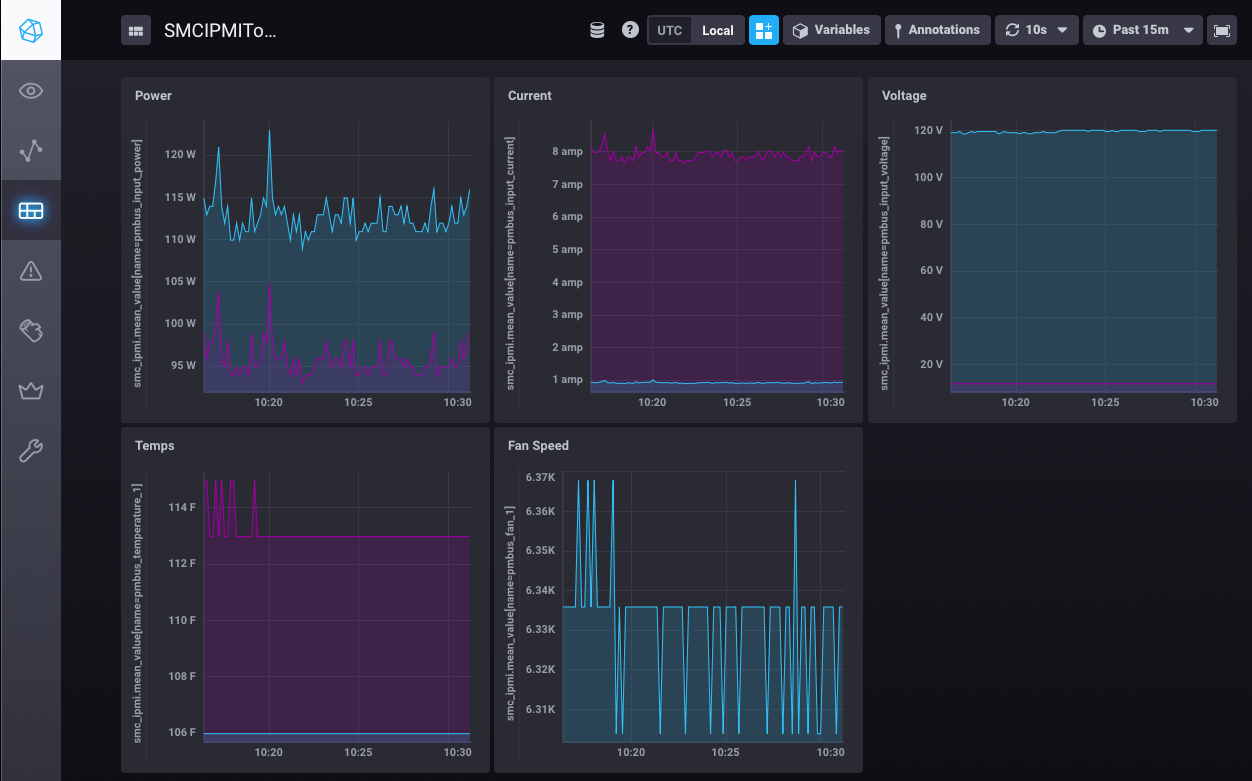
Here's a very basic Chronograf dashboard that shows some of the additional power supply data that isn't available with the current IPMI plugin